![]()
 |
|
|
|
|
Does Economic Development Pay For Itself In Nevada?A Research Paper Presented at the 1999 Annual Conference on Economic DevelopmentAugust 25, 1999 Prepared by the Commission on Economic Development, Research Division
EXECUTIVE SUMMARY Over the years there has been increasing public comment from the hotel/gaming sector of Nevada's economy regarding growth and its effects on taxation. Nevada's tax structure is pointedly designed to use gaming as a primary source of income for services, allowing its citizens to enjoy a relatively low per capita direct cost of taxes.
Many times during recent years the gaming lobby has proposed changes in the basic tax stucture of the state. This has been met with varying degrees of success. The gaming industry has attempted to prove that because of the basic tax structure, and the reliance by the state on its revenue from gaming, growth by any other business sector costs gaming additional dollars not in proportion to the tax structure. Through the use of the nationally recognized REMI econometric modeling program, Policy Analysis, this paper will discuss some of the other possible ways to look at this issue. The efficiency of population growth, to whom that growth and the associated government services may actually be attributed to, and the difference in increase of government employees generated by differing business sector activity, will be some of the examples used to examine more closely whether economic development pays for itself in Nevada. Ultimately the results of the public policy debate should assist policy makers in recommending standards and options for developing a fair, viable and economically competitive State and local tax system capable of generating sufficient revenues to meet the expected needs of the future. BACKGROUND During the 1999 legislative session, a public policy debate was sparked over whether economic development efforts have an economic return to Nevada sufficient to justify the level of investment of public monies. During the session, the members of the gaming lobby attempted to cast doubt on whether growth pays for itself. The gaming lobby attempted to prove diversification of the economy strains the resources of the state rather than strengthens them. An additional implication was that the manufacturing industry does not generate sufficient tax revenue to support further recruitment and retention of businesses. Measurement of who ultimately bears the burden of taxation is a difficult and convoluted process because of the complex ways in which taxes are passed through to consumers of goods and services. The gaming lobby's expressed fear of a disproportionate tax burden does not address the full measure of costs and benefits of the current tax structure in Nevada. Indeed, one of the fundamental characteristics of a reasonable tax system is the idea of broad base, whereby a broad base helps to distribute the tax burden, "and, by contributing to low rates, minimizes the effect of taxation on the private sector's economic decisions."1 Recently an article in the Las Vegas Business Press2 addressed diversification of the tax base. The article quoted Mike Clarke, an employee with the state Department of Employment, Training and Rehabilitation (DETR), and portrayed as "one state economist." Mr. Clarke stated that under the current tax structure, there is "no sense" in diversifying the economy. In direct contrast to the stated mission of the Commission on Economic Development,3 Mr. Clarke asserted "the virtues of diversification may be overstated in any case." Apparently addressing Nevada's tax structure, the Business Press article states that "bringing in businesses that aren't paying taxes is defeating the purpose of diversification and puts a strain on services." The Commission, however, is unaware of any business in the state not subject to taxation of one kind or another. As demonstrated below, all businesses are subjected to a substantial variety of taxes and fees. In "The Fiscal Impact of Population Growth in Nevada"4, a document sponsored by and developed for the gaming industry, the point is repeatedly made that the gaming industry employs only 22% of the workforce, yet pays 55% of the taxes. The industry surmises the rest of the business community does not bear its fair share of the tax burden based on those two facts and that the tax revenue structure of the state is thus overly reliant on the gaming industry. They further conclude the equitable remedy is to diversify the tax structure rather than the tax base, that is, shift taxes away from the gaming industry and more toward other economic segments of the state. In effect, the study concludes economic development efforts do not bring sufficient tax revenues to justify the program and results in further burdening an already overburdened gaming industry. The facts of the gaming study are correct as far as they go. The underlying assumptions of the gaming lobby argument, however, do not consider the full extent of the actual economic inputs and outputs. The gaming lobby conclusions ignore a significant portion of the actual economic impact of diversification and industry recruitment. Consequently, the Commission on Economic Development directed staff to examine the basis of the gaming industry proposition and to see whether the gaming lobby conclusions were a fair reflection of the Nevada economy and the impact of business diversification. The following study was prepared as a result of the Commission's directive. HISTORICAL PERSPECTIVE OF THE TAX BASE AND TAX STRUCTURE In 1931, the Nevada Legislature legalized gaming. Since its inception, gaming has been a core industry to the state and has provided needed revenue for local and state government services. By legislative design, gaming taxes5 and fees have provided enough revenue to relieve much of the tax burden from individual citizens of the state. The gaming industry continues to provide much of the state's revenue. From July 1, 1998 through June 30, 1999, Nevada's gaming industry won $8.5 billion from gamblers generating approximately $500 million in tax revenues. This reflects a year to year growth rate of 7.9%.6 In the fiscal year ended June 30, 1998, sales taxes, strengthened by tourism dollars as a result of the gaming industry, totaled 71% of the Department of Revenue's income for a total of $512 million. 7 Other sources of state revenues, besides gaming, and their distribution may be found in Table I below, obtained from the Department of Taxation's Annual Report for Fiscal Year Ended June 30, 1998. In addition to state tax revenues, businesses are also subjected to local property taxes, motor vehicle privilege taxes, real property transfer taxes, and assorted fees. Over time, a number of exemptions to sales and property taxes have been granted benefiting various segments of the Nevada community. Although exemptions may be perceived as correcting inequities or regressivity, there are often unintended tax shifts which may add tax burden to certain sectors. Narrowing of the tax base can also reduce overall available revenue for services. In recent history, a number of legislative attempts to diversify the tax structure have met with mixed reaction and a variety of levels of success. In 1981, a major property tax shift occurred in which the growth in property taxes for homeowners and commercial businesses was limited. As a result, greater reliance was placed on sales and gaming taxes. Over the years a variety of exemptions have been enacted in both sales and property taxes, contributing to the narrowing of the tax base.
In the 1991 legislative session, a "business tax" was passed in an effort of compromise to broaden the tax base and provide additional revenue for state government. Also during the 1991 session, an attempt was made to implement a 5% "net profits tax" on business. Written into the bill was a passage that would allow a tax credit for any type of gaming tax to be applied directly to any liability of the "net profits tax."8 In effect, the "net profits tax" was designed as an income tax on business. The bill died in 1991, but the idea is not yet buried. The current Nevada Education Association web site9 discusses the possibilities of bringing about a referendum to resurrect the net profits tax, presumably with the gaming tax credit allowed as before. The manufacturing segment of the Nevada economy, on the other hand, is growing significantly on a year-to-year labor comparison. In 1998, the industrial sector showed a 3.3% net growth over 1997, according to ES202 data published by Nevada's DETR. During the same period, nationally the manufacturing sector lost employment. With the assistance of Nevada's development authorities, the Commission on Economic Development brought in more thatn 8,000 new jobs in calendar year 1997. PROJECT DESIGN AND SCOPE In order to study the impact of economic diversification and growth, the Commission used a "dynamic econometric modeling program" called Policy Insight, developed by Regional Economic Models, Inc. (REMI) of Amherst, Massachusetts. Founded in 1980, REMI constructs models that reveal the economic and demographic effects policy initiatives or external events may cause on a regional economy. One of the major features of the REMI model is that it is a dynamic model which forecasts how changes in the economy and adjustments to those changes will occur on a year-by-year basis.10 Additional statistical assumptions were provided by Dr. Keith Schwer of the Center for Business and Economic Research, University of Nevada, Las Vegas. Dr. Tom Harris, director of the Reno Center for Economic Development, University of Nevada, Reno, also provided additional information and background. The outputs of the REMI model are extensive, and only the most pertinent outputs will be discussed relative to the appropriate outcomes for the original premise of this study. Inputs on the other hand, are absolutely critical for maintaining the integrity of the study. The first parameter or "input" of the study is to refrain from "overstating the case." In order to make this study as simple as possible yet still allow an answer to the question of whether economic development pays for itself, a number of experts in the economic modeling field were consulted, including consultants with REMI who have assisted states with similarly structured studies. The structure of the model used in the Nevada study is designed to compare the relative impact of gaming and manufacturing. The model "shocks" the economy with the introduction of 8,000 new employees into each industrial sector, principally hotel and manufacturing and then compares a full range of economic costs and benefits. These sectors were then segmented into appropriate sub-sectors. Segmentation for the hotel and manufacturing sectors was handled differently for each. The hotel sector was segmented into three sub-sectors based on discussions with Dr. Schwer.11 Of the 8,000 new jobs, 5,300 were assigned to the "hotel" sub-sector; 2,000 were assigned to "entertainment and recreation;" and 700 were assigned to "rest of retail" which is retail except the "eating and drinking" sub-sector. Segmenting the manufacturing sector was more difficult. By taking the 8,200 jobs created in 1997 as listed in the Commissionís 1997-1998 biennial report, 12 relative percentages by industry segment were determined. The percentages were then applied in developing a matrix reasonably representing an average year of general diversified growth in Nevada. Table II below provides details of sector segmentation.
The model was further modified by updating wage rate data for each segmented sector by accessing the Wage Bill aspect of the Wage, Price and Profit Block in the REMI model. Then, with calendar year 1998 wage rate figures obtained from DETR13, the differences in any project wages were calculated and inserted in the model. Inserting actual wage rate developed by DETR enhances the results of the model, rather than allowing the model to calculate based on assumptions. The following table provides the calculations inserted into the model to adjust wages to their actual value as reported in 1998.
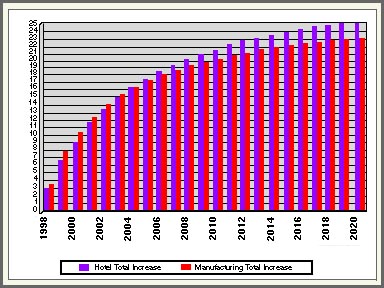
Due to the fact this study is intended to examine the impact of the creation of 8,000 jobs in each of the two categories, "hotel" and "manufacturing," the model did not consider any explicit "construction" impacts. The study simply looks at the jobs through the projected year 2020. No other changes were made to the REMI model prior to running the simulation as described above. SIMULATION RESULTS After actually running the simulations to compare the impact of 8,000 jobs in hotel versus 8,000 jobs in manufacturing, the simulations were also compared to the REMI standard regional control, and each other. The simulations include the "multiplier effect" or "ripple effect" from a particular industry in other non-sector-specific jobs and opportunities. In other words, the simulations show the effects of both indirect jobs created by related industry and induced jobs, that is, those jobs created by the spending of direct and indirect jobs. Indirect jobs represent employment as a result of the particular industrial activity but are not directly part of it. For example, a local produce company supplies a hotel with produce for its restaurant operations. To the extent the produce company employee has a job due to the hotel industry purchasing the product, the job created is termed an "indirect" job.14 Alternatively, many jobs created by various industries are "induced" jobs. Employment and increases in household income from direct spending of a particular industry, such as wages, creates spending by employees and others. Increased spending by employees and others creates "induced" jobs. For example, the cashier at a supermarket whose job was created to accommodate primary industry employees may be an indirect job, but the cashier in turn shops at the mall creating additional employment for retailers. The retail jobs would be termed "induced" jobs.15 The differences among direct, indirect and induced jobs are critical in understanding the overall economic impact of primary new jobs, not just the direct fiscal impact. In other words, both sides of the "balance sheet" must be taken into account. If an industry is attempting to demonstrate the impact of direct jobs, then only the revenue stream associated with direct jobs should be considered in the amount of tax revenue generated for governmental spending. If an industry is attempting to demonstrate the impact of direct jobs but adds the impact of indirect and induced jobs to the revenue stream, a mismatch of assumptions and results occurs. This study matches each respective revenue stream with the appropriate source. One of the issues associated with impact analysis is the level of population as growth occurs. With the example of 8,000 new employees in each of the hotel and manufacturing sectors, the associated population growth is easy to see in Table IV below. The hotel sector is not contributing more base population until after about the fourth year of the scenario. This is an important factor, since in past studies it has been assumed the population growth generated by the growth of hotel industry jobs maintains the same numeric relationship as employment in the industry.16 According to the simulation this is not the case. Table IV below indicates that after the fourth year the hotel industry continues to generate population growth long after the manufacturing segment influence on population slows. The significance of continued population growth caused by increased hotel industry jobs should not be understated. The higher growth rate of population due to the hotel industry is significant because of the increased burden in government services which population growth brings.
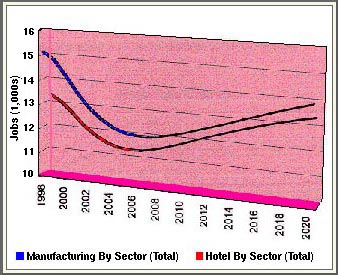
Once again, this table does not include any of the traditional construction impacts usually included in an impact study in order to isolate the impacts of the hotel and manufacturing industries. The number of jobs, as they relate to the increase in population, provides a good indication of the efficiency of the economy of a particular industry. Table V depicts employment by sector. When read in conjunction with Table IV (population graph), the results indicate the manufacturing sector produces more jobs but results in less population growth or migration. This indicates the manufacturing sector is much more efficient than the hotel sector. In fact, the simulation indicates the manufacturing sector creates nearly 2,000 more jobs than the hotel sector in the first few years. As the time continuum of the simulation approaches its completion in the year 2020, there are only about 600 jobs difference, but these are still in favor of the manufacturing sector.
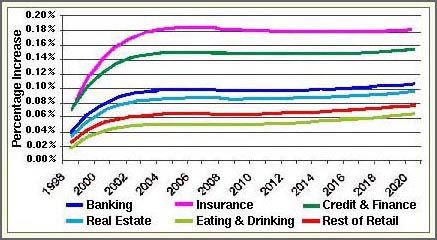
During the same time frame used in the job creation simulation, there is a population increase as previously displayed in Table IV. The hotel sector population growth surpasses the manufacturing sector population growth in the year 2003. By the year 2020, there are over 2,200 more citizens from the hotel sector compared to the manufacturing sector. This provides evidence that over time, manufacturing jobs will indirectly induce more jobs per population increase than the hotel sector. The true efficiency of the jobs compared to the government services required is significant in the most basic of cost/benefit ratios. Significant proof of job efficiency also occurs when the REMI model simulates the future wage rates of various sectors after the 8,000 employees are added into each of the study's sectors. In Table VI the projected percentage differences in wage rates, for a number of different sectors, show the manufacturing sector jobs will create a higher wage for these other sectors than the hotel industry would. This simulation provides results comparing the manufacturing sector directly to the hotel industry rather than comparing both sectors to the REMI regional control. This produces a "head to head" differentiation of the two industries.
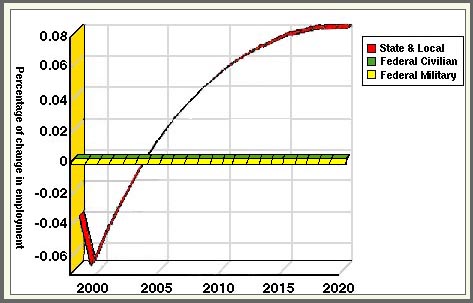
It is easy to deduce with the data presented above that the manufacturing jobs provide a stronger spin-off of indirect and induced jobs. Two tenths of a percent may not seem like very much but when it is calculated against the total wages paid in Nevada over calendar year 1998, it amounts to nearly $56 million. That level of leveraged fiscal activity is significant. Earlier it was noted that the hotel industryís increased population component was partially due to increased government services. This is graphically portrayed in Table VII. Here, through the REMI simulation, the number of additional government employees needed to provide services to the hotel sector is shown in direct competition to the manufacturing sector. It is important to note the graph translates into direct numbers of employees. The hotel segment starts with an immediate decline of about 28 employees and then increases during the next 20 years to over 120 more government employees than manufacturing would have caused.
This seems like insignificant percentages that should not mean much at all, but if the actual numbers are applied to the 1998 wage rate study provided by DETR, the actual cash outlay of 120 government sector jobs would be $4.3 million, not including benefits or inflation. This is increased revenue the government must have on an annual basis in order to maintain services to 8,000 hotel industry jobs compared to 8,000 manufacturing jobs. ANALYSIS OF THE GAMING POSITION As regional industries expand into national or international markets, it is a fairly well-accepted premise that tax incidence shifts. When the industry is regional in nature, that is, confined to either a geographic or regulatory area, a majority of taxes are passed directly to the consumer. When regional industries expand in the marketplace to become ìnationalî in nature, taxes cannot be as easily passed through to consumers. According to a REMI consultant, various studies support the feasibility of an 80/20% reciprocity. The reciprocity formula refers to the idea that regional industries can pass through 80% of taxes, particularly increases. In a nationalized industry, only 20% of the increases can be feasibly passed through to consumers. The balance of the percentage, whether regional or national, is then effectively deducted from the industry's "bottom line."17 This is the case in the gaming industry in Nevada. In 1978, other states began legalizing gambling. Gaming became a national industry with the associated problems of tax increase pass through. This is one of the reasons why the gaming industry is questioning whether growth pays for itself - a fear of taxes increasing which cannot be as easily passed through to consumers, thus affecting the bottom line. The gaming industry therefore pushes to diversify the tax structure instead of the tax base. Instead of making the tax revenue pie "bigger," gaming wants to cut up the revenue pie in a manner more in its favor. CONCLUSIONS The gaming industry claims economic development and diversification is a hindrance rather than a help to the overall health of Nevada's system of taxation. But what should we reasonably expect from a system of taxation? A "good" system of taxation would be characterized by the following:
The gaming industry study failed to examine the job efficiency, broad base, and productivity aspects of the contributions of economic diversification to the taxation system. The simulations conducted by the Commission, on the other hand, show the manufacturing jobs brought to Nevada through the efforts of economic development groups promote job efficiency and do not cause the order of magnitude "strain on resources" claimed by gaming. In fact, the simulations show it is the population growth sustained by hotel industry jobs which conceivably cause a "strain on resources." The diversification of the economy, furthermore, promotes a broad-based system of taxation in which reliance on gaming revenues is much less than it could be given the revenue needs of state and local governments. Finally, the creation of a strong manufacturing segment in the Nevada economy serves to mitigate the cyclical problems generated by relying too much on the fortunes of any one industry. One need look no further than the mining industry to see the havoc wrecked on local governments dependent on net proceeds of minerals taxes when the gold industry is in serious decline. Economic development promotes the diversification so desperately needed by many Nevada communities. FOOTNOTES:
LISTING OF REFERENCE MATERIALS
LISTING OF INTERVIEW AND SEMINAR SOURCES
LISTING OF TABLES Table I. Tax revenues and distributions
by categories.
|
|||||||||||||||||||||||||||||||||||||||||||||||||||||||||||||||||||||||||||||||||||||||||||||||||||||||||||||||||||||||||||||||||||||||||||||||||||||||||||||||||||||||||||||||||||||||||||||||||||||||||||||||||||||||||||||||||||||||||||||||||||||||||||||||||||||||||||||||||||||||||||||||
|
|
|
|
|
|
|
CORPORATE |
NEVADA |
LETTERS |
LINKS |
BARBWIRE |


Back
to Silver State COP home page
![]()
Site designed &
maintained by Deciding
Factors
Comments
and suggestions appreciated Get on our news and bulletin lists.